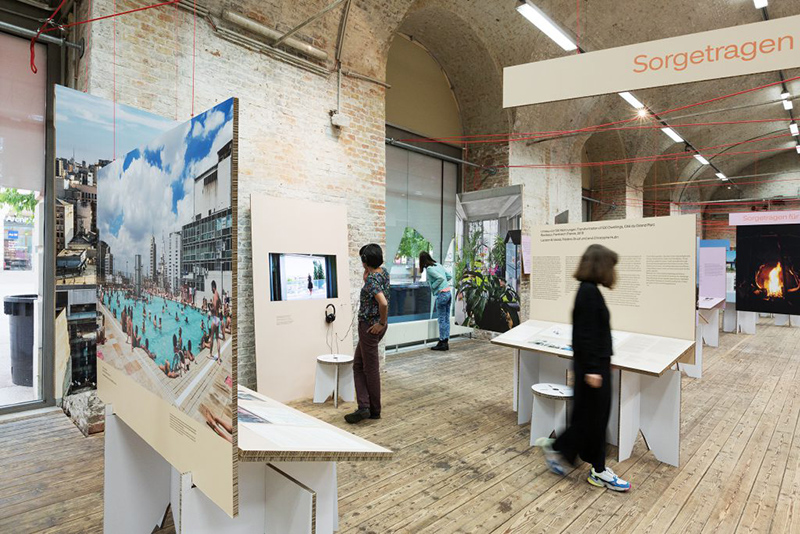
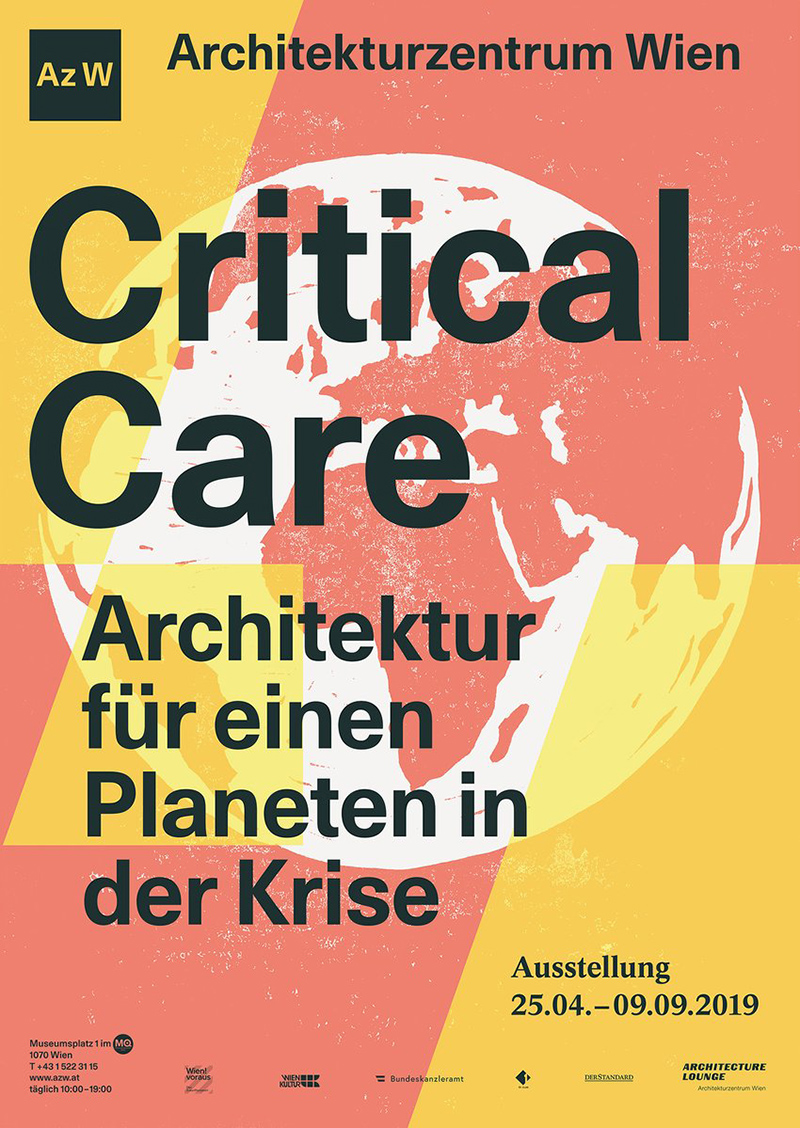
Exhibition


A project for the exhibition Critical Care. Architecture for a Broken Planet, together with Chen Yang from Studio Sejima / architectural design.
For this exhibition, Bernhard Sommer (head of the Energy Design Department from the University of Applied Arts Vienna) created an air-circulation-solution that works with thermodynamics. To make the impact visible, we created a data visualization that is mapping the changing carbon dioxide level in the airflow.
This project was running during the exhibition at Architekturzentrum Wien in 2019.
Architekturzentrum Wien, exhibition: Critical Care
Task: visualizing the low-tech air circulation, that is using thermodynamics.
We measured the air quality on different spots with MQ135 sensors.
Reading the values via Arduino:
Using the carbon dioxide values, we created parameterized 3D objects via Grasshoppers visual programming. The values are translated now into 3D spheres in Rhinoceros.
We designed the sensor cases, created models and 3D printed them. The aspiration was to protect the sensors from rain & to be pervious to air.
The final outcome was exhibited on a screen at the exhibition »Critical Care, Architecture for a Broken Planet«.
The interface design:

